

A fuel entry without the proof.
Keep the odometer and completed pump photos with the driver’s readings, vehicle, card, station and capture time.
Give every fill-up a trailBEFORE THE NEXT MONTH-END
Bring fuel photos, card statements and workshop invoices into one clear trail—before another month closes.
THE COST OF LEAVING IT UNTIL LATER
Disconnected photos, spreadsheets and invoices leave questions behind. LitreLite puts the evidence beside the numbers, so your team can investigate the gaps while the details are still available.
Keep the odometer and completed pump photos with the driver’s readings, vehicle, card, station and capture time.
Give every fill-up a trailCompare statements with submissions. Review differences, duplicate references and missing evidence instead of accepting the totals at face value.
Put the records side by sideConnect the work performed, its approval details, cost and invoice to the asset. Then explore patterns across suppliers and work types.
See where workshop spend goesA CLEARER WAY TO WORK
Follow one example through the fuel trail.
Interactive illustration using fictional records. This walkthrough does not submit data.
ONE CONNECTED SOLUTION
Explore the actual LitreLite interface. Every screen below comes from the fictional demonstration workspace.
FUEL RISK INTELLIGENCE / PUBLISHED DEMO
Which vehicle, card, station or ticket deserves your attention? Move from the executive view to the source transaction, then check the evidence before the next month closes.
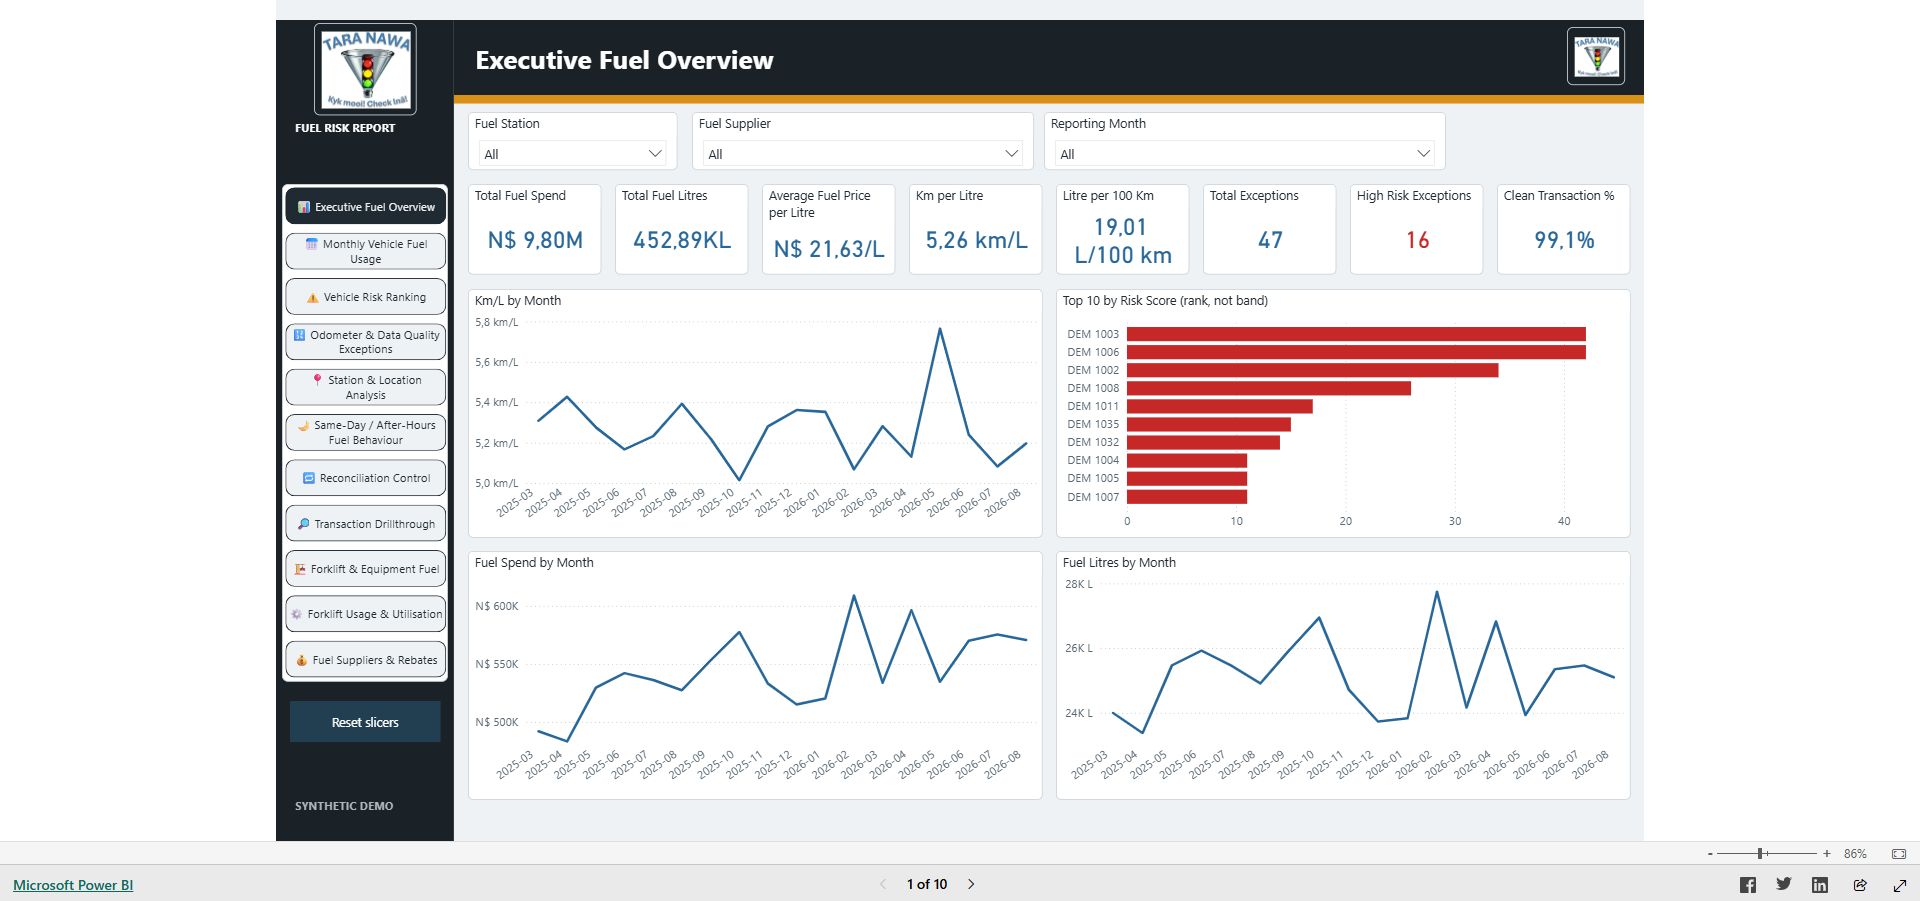
Fuel activity, behavioural signals, vehicle risk, control checks and equipment performance in one report journey.
A risk signal is a lead for investigation. It is not proof of wrongdoing.
Use the report’s left navigator to reach all 11 pages, including Transaction Drillthrough; the bottom counter shows 10 standard pages. Slicers apply immediately. Reporting Month is shared across pages, and Fuel Station and Fuel Supplier are shared between Executive and Monthly. Other selections can be local to a page.
Reset slicers clears the current page and shared selections. It does not clear every local slicer on every other page.
ELEVEN VIEWS. DIFFERENT QUESTIONS.
Open a page guide to see what it shows, what to check and where to go next.
Fuel spend, litres, price, efficiency and exception KPIs. Monthly trends and Top 10 risk rank show where to start.
Compare a selected month with the trend. A high count or spike needs the underlying vehicle and ticket checked.
Set Reporting Month, station or supplier; then open Risk Ranking or the exception register.
Monthly spend, litres and transaction counts by vehicle, plus all-source distance and fuel efficiency.
Look for sudden changes in fills, spend or litres. Check Vehicle Data Status before reading km/L.
Select vehicle, month, station or supplier; then use Transaction Drillthrough for source tickets.
Vehicle score bars use Low green, Medium amber and High red. Fuel spend remains a separate neutral comparison.
Compare score band, component detail in the table and spend. A high spend alone has no approved severity rule.
Use Location, Vehicle Type and Reporting Month; open View exception register for the underlying signals.
Exception counts by type and severity, with a register of affected records.
Separate a data-quality problem from suspicious fuel activity. Read type, severity, vehicle, date and status.
Filter severity, type, vehicle and month; open the matching transaction in Transaction Drillthrough.
Fuel spend and litres by station, with supplier, location and product context.
Compare a station’s spend with litres and vehicle mix. Unusual concentration needs route and contract context.
Filter supplier, month, location and product; check the transaction summary, then individual tickets.
Counts and transaction lists for repeated same-day, after-hours and weekend refuelling.
Check timestamps, fill size, card and vehicle. Compare with shifts, route plans and authorised refuelling.
Filter vehicle, month or card; note transaction IDs and open Transaction Drillthrough.
Differences in invoice amount and litres, by month and source invoice.
Identify unmatched or out-of-balance invoices and check whether rebates, credits or fee lines explain the gap.
Inspect the invoice reconciliation row and trace the invoice or ticket in transaction detail.
Transaction-level evidence: date, ID, vehicle, card, ticket, odometer, station, litres and spend.
Read Exception Severity cell independently of mileage quality. Scroll horizontally for litres and spend totals.
Filter Supplier, Vehicle, Card Number, Ticket Number or Severity; compare repeated tickets with station code.
Forklift fuel spend, litres, transactions, open exceptions, price and transaction detail.
Compare fills and open rules by forklift. Confirm fuel-only rows and examine unusually frequent fills.
Select forklift and Reporting Month; move to Forklift Usage to evaluate operating-hour coverage.
Operating hours, fuel L/h, productive utilisation, coverage and invalid meter reads.
Inspect excluded fuel litres and invalid readings before interpreting L/h. Compare scheduled and productive hours.
Filter forklift and month; review meter intervals and daily shift detail for the same period.
Supplier spend mix, rebate total, net spend after rebates and credit-note register.
Match rebate amount, supplier and credit note to the applicable invoice period. Check large supplier exposure.
Use the supplier register as evidence; revisit Executive or Station Analysis for spend context.
READ THE CLASSIFICATION
The score combines consumption, spend, litres, exception count, same-day fills, after-hours and weekend activity, and invalid odometer readings.
The Top 10 chart is a relative ranking. Red bars do not mean every vehicle has a High band. A High exception does not automatically make the vehicle High risk, and high spend alone has no approved severity rule.
Other flags include unusual fill size, invalid odometer readings, product mismatch and fuel-price anomalies. Confirm the applicable rule and record context before acting. Check duplicate ticket references together with the station code.
FROM ALERT TO EVIDENCE
Use the report to locate the signal; verify the explanation against supporting records.
Select the month, vehicle, station or supplier. Keep those selections in the case note.
Record exception type, severity and status; record the vehicle risk band separately.
Open the transaction ID. Check ticket and station together, card, time, litres and spend.
Compare normal fills for the same vehicle, route, station or shift. Check meter validity.
Obtain receipts, invoices or settlements, card history, dispatch and maintenance evidence.
Record the explanation, evidence, owner and resolution. Escalate only after human review.
Set Reporting Month to 2026-07. These fictional practice leads are not allegations and are separate from the August driver-capture illustration above.
| Signal | Vehicle | Transaction IDs | First evidence check |
|---|---|---|---|
| Duplicate ticket | DEM 1031 | 910001, 910002 | Compare receipts at NFN001 |
| Repeated fills | DEM 1032 | 910004, 910005 | Check 08:00 and 09:30 fills |
| After-hours fill | DEM 1033 | 910006 | Confirm the 22:35 shift |
| Card mismatch | DEM 1034 | 910007 | Confirm card assignment |
| Invalid odometer | DEM 1035 | 910008 | Inspect the meter record |
| Station concentration | DEM 1036 | 910009 to 910011 | Compare route and invoices |
Moving to a controlled pilot: agree approved source data, confirmed rules and thresholds, a named evidence owner and a resolution process. Human review determines whether a signal is explained, unresolved or needs escalation.
ACCOUNTABILITY NEEDS BOUNDARIES
Sign in with a fuel card number and a separate LitreLite PIN. Photograph the odometer and pump, review the readings and save the fuel stop.
View the pages assigned by the administrator. Request an edit or deletion with a reason, while the saved records remain protected from officer changes.
Manage company records, statements, workshop logs and reports. Review officer requests in Notifications and follow links to the relevant record.
Set up client profiles, company branding and administrator access. Manage client activity from the CRM while each client works within its own records.
SMALL PERCENTAGES. REPEATING QUESTIONS.
You don’t need to assume a major problem to start asking better questions. Put a small portion of monthly fuel spend into perspective.
This is a spend illustration—not a measured loss, fraud estimate or promise of savings.
Monthly spend × selected percentage. The annual figure assumes the same spend each month.
Start asking the right questionsSTART WITH THE CONTROL YOU NEED
Discuss your fleet size, statement volume and workshop needs. We’ll agree the scope, onboarding and quotation with you.
GET THE FUEL TRAIL IN ORDER
For teams that need clear evidence and a more structured month-end comparison.
CONNECT FUEL AND WORKSHOP COSTS
For businesses ready to connect the fuel trail with maintenance, invoices and oversight.
AGREE THE NEXT LEVEL OF SUPPORT
For larger fleets or teams needing a tailored rollout, training and reporting scope.
Packages describe proposed scopes. Final features, fleet allowance, service commitments and pricing are confirmed in your quotation.
The LitreLite workflows presented here use driver evidence, statements, fleet records and workshop information. They do not require GPS tracking hardware or live fuel sensors.
No. Photo reading helps prepare values for review. Drivers must check the suggested odometer, litres and amount against the images and correct them before saving. Image quality matters.
LitreLite supports Excel, CSV and PDF statement imports with field mapping and review. Relevant fields include card, vehicle, station, reference, date, time, mileage, litres and amount. PDF quality and layout can affect extraction; imported rows must be verified before saving.
Repairs, maintenance, brakes, tyres, batteries and upgrades each have dedicated fields. Save the relevant asset, work details, supplier, costs, status and applicable approvals or downtime, and attach the invoice files to the job.
Fleet Officers have read-only access to the pages assigned by their administrator. They can submit a supported change request. Administrators receive in-app notifications and configured email alerts, then review and apply any authorised changes.
The workshop dashboards shown here run inside LitreLite with a Power BI-style layout, filters and drill-down. A published Power BI fuel-risk report can also be configured where applicable. Client-specific Power BI development, secure embedding and licensing need an agreed scope.
Book a walkthrough and discuss your fleet, cards, stations, statement formats, workshop needs and users. We’ll agree a package, data preparation, onboarding and quotation. No subscription or trial is started by using this presentation.
MAKE THE NEXT MONTH-END DIFFERENT
Let’s walk through how LitreLite can fit your fuel, fleet and workshop processes.
Already a client? Open LitreLite